Debug panel
Debugging is a key step when you are developing or coding. This is not different for the Silverfin Templating Language. Since debugging can sometimes be tricky to do, we have developed a debug panel to facilitate this process. The purpose of this panel is to give you more detailed information on what a template is doing, without having to deep-dive into the code.
This guide will provide you with an overview of all the functionalities that are present within the debug panel.
How to activate?
The panel can be activated on client/company level by adding ?debug=1 at the end of the URL, and then pressing ENTER. Make sure that you are in the input mode of the template, the debug panel won't work when activated in preview mode.
After pressing enter, a new section will appear at the bottom of the template:
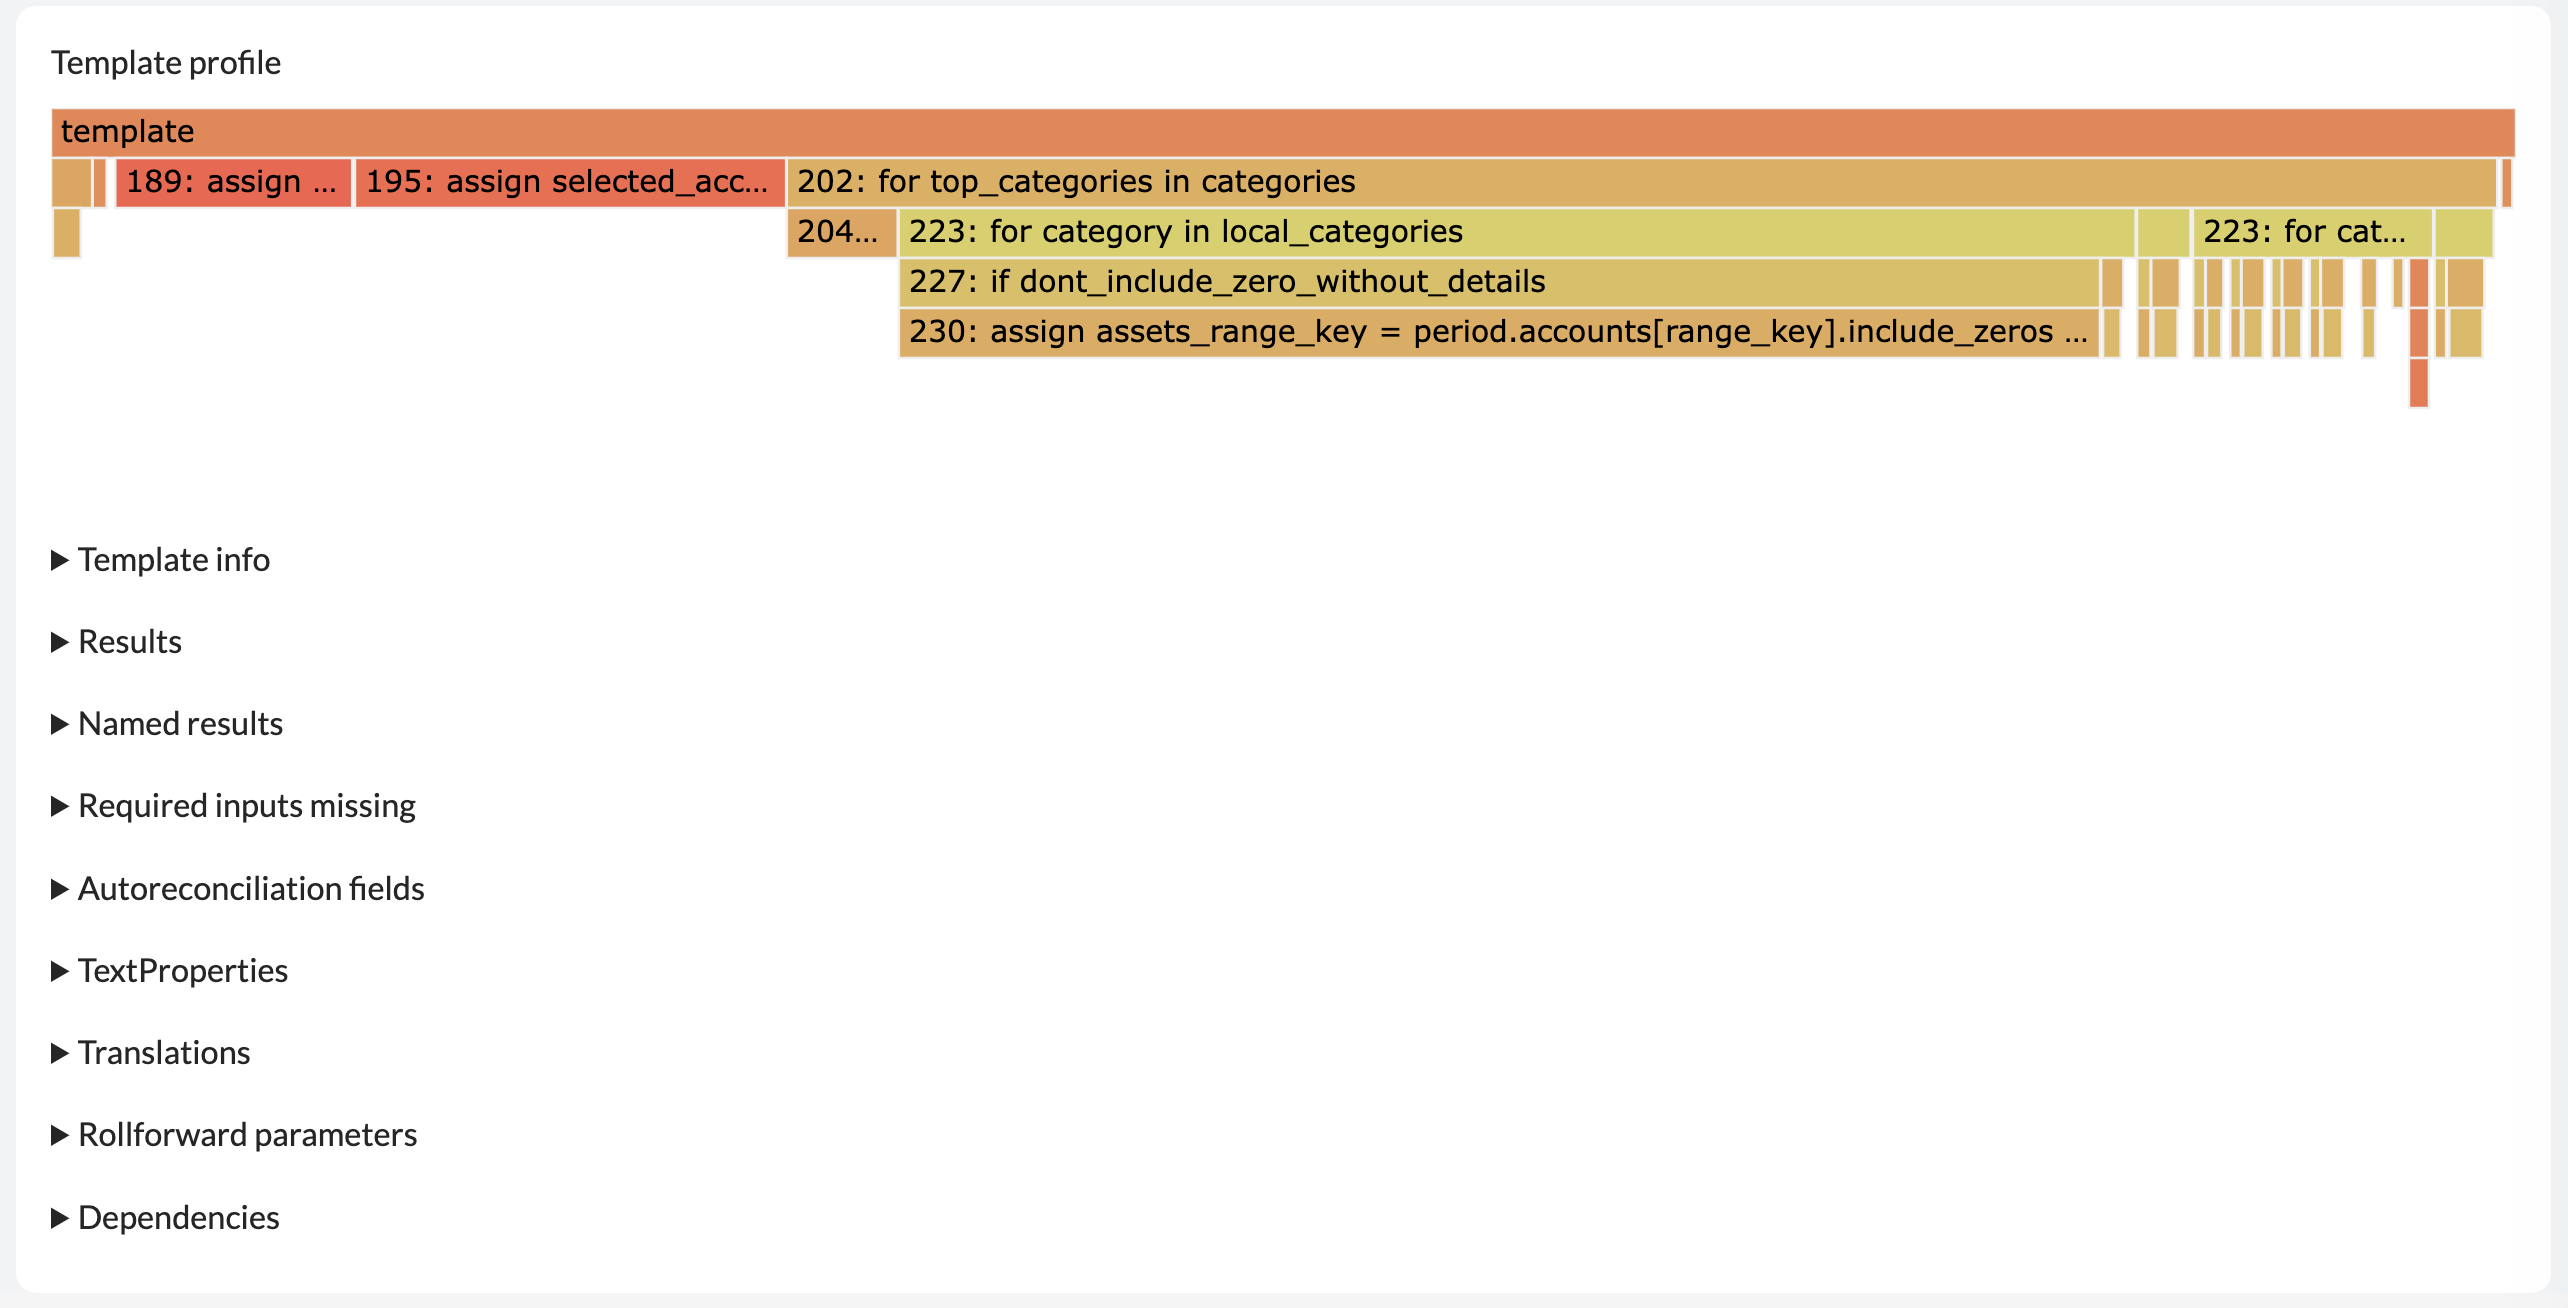
Alternatively, to save you some time, we have created a small JavaScript function to automatically add ?debug=1 to the link. This can be stored in a bookmark in your browser of choice (e.g. Google Chrome). If you then need to activate the debug panel, you only need to click on this bookmark.
javascript:void((*function*(){var locHasAnchor = location.href.split('#').length > 1 ? true : false; var loc = locHasAnchor ? location.href.split('#')[0] : location.href; var anchor = locHasAnchor ? '#' + location.href.split('#')[1] : '';if (loc.indexOf('debug') >= 0) return; loc.indexOf("?") < 0 ? (location.href = loc+"?debug=1"+anchor) : (location.href = loc+"&debug=1"+anchor);})());We will now go through all the different items, and explain what information then contain and how it can be useful.
Flame graphs

Flame graphs are a great tool to investigate the loading time of a certain template. Each block in the flame graph represents a certain coding function/part (e.g. a fori-loop or an if-statement). If you hover over a certain block, it shows you how much time it takes to run that piece of code in mili-seconds.
For further analysis, you can then click on the block you need to investigate (each block shows the line number of where the code starts), and all the blocks beneath it are parts of your selected block (so the sum of the loading time in mili-seconds of the sub-blocks will be equal to the loading time of your selected block).
Having insights into the loading times will eventually allow you to optimize the code where needed, and make your templates load/render even faster.
Template info

The ‘Template info’ section contains some generic information on the template. All this information corresponds with what can be input in the ‘Edit reconciliation’ page:
- Handle (template identifier used to refer to this template)
- Auto-hide formula (formula that determines if the template should be shown on Company level)
- Virtual account number (number used to define the order of the template in the PDF export)
- Type (reconciliation type selected for this template)
- Firm level (link to the firm level where the template code is maintained)
- Partner level (link to the partner template, only applicable for templates that come from the Silverfin Marketplace)
Results

The ‘Results’ section displays the outcomes of the different unreconciled checks that are being executed in the code. Unreconciled indicators expect a couple of parameters (see Reconciliation of a template). The first parameter is the reconciliation itself. Often, this is set to 1 when we want to display the indicator (e.g. unreconciled 1), but it can also be the result of a calculation (e.g. unreconciled trial balance value - template total).
An outcome different from 0 will lead to the indicator showing unreconciled, and as a result, the template itself will become unreconciled as well. Only when all reconciliations are equal to 0, the template will show a green dot.
In the above example, two unreconciled checks are being executed in the code (resulting in a difference of 50 for the first, and 10 for the second one). Since both of them are different from 0, our template will become unreconciled as well (which can be seen by looking at ‘Total’).
So if you are ever in a situation where you don’t know why your template is unreconciled, this section will help you find which check results in a difference, and exactly what that difference is.
Named results

The ‘Named results’ section will list all the result tags created within the code. This can be a great help, since you don’t have to dive into the code anymore, looking for variables that you need to refer to in other templates.
Cache Issue
When a cache issue exists, you will see a warning text in the Debug panel with the following text:

Cache issues are most likely related to a four level dependency issue. It will be flagged in the debug panel with the previous warning text, and you can actually see the difference between the current result and the one stored in the cache in a new section named "Diffs with cached results".
What does this difference mean?
It means that templates that access results from this reconciliation will have access to the value stored in the cache, which will no longer be inline with the currently generated result.
How to interpret this message ?
When you see this warning text in the debug panel of one the reconciliations, it means that the current reconciliation is already (at least) at the third level in the chain of the dependencies. And other templates using results from this reconciliation will face cache differences.
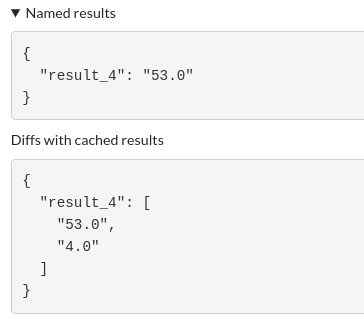
Looking at the previous example, you have a result named result_4 and its value is 53.0. But, the value stored in the cache for this result is 4.0, and that's the value that any other reconciliation will fetch from this one when calling upon the result. This means that outdated data flows through to the next template in the chain.
Required inputs missing

This section will provide a list of the inputs that are indicated as ‘required’, but that do not contain any data yet. These missing inputs will result in the template being unreconciled (See our community case on how required exactly works).
Similar to the ‘Results’ section, this can provide you valuable information if you do not know why your template is being unreconciled.
Autoreconciliation fields
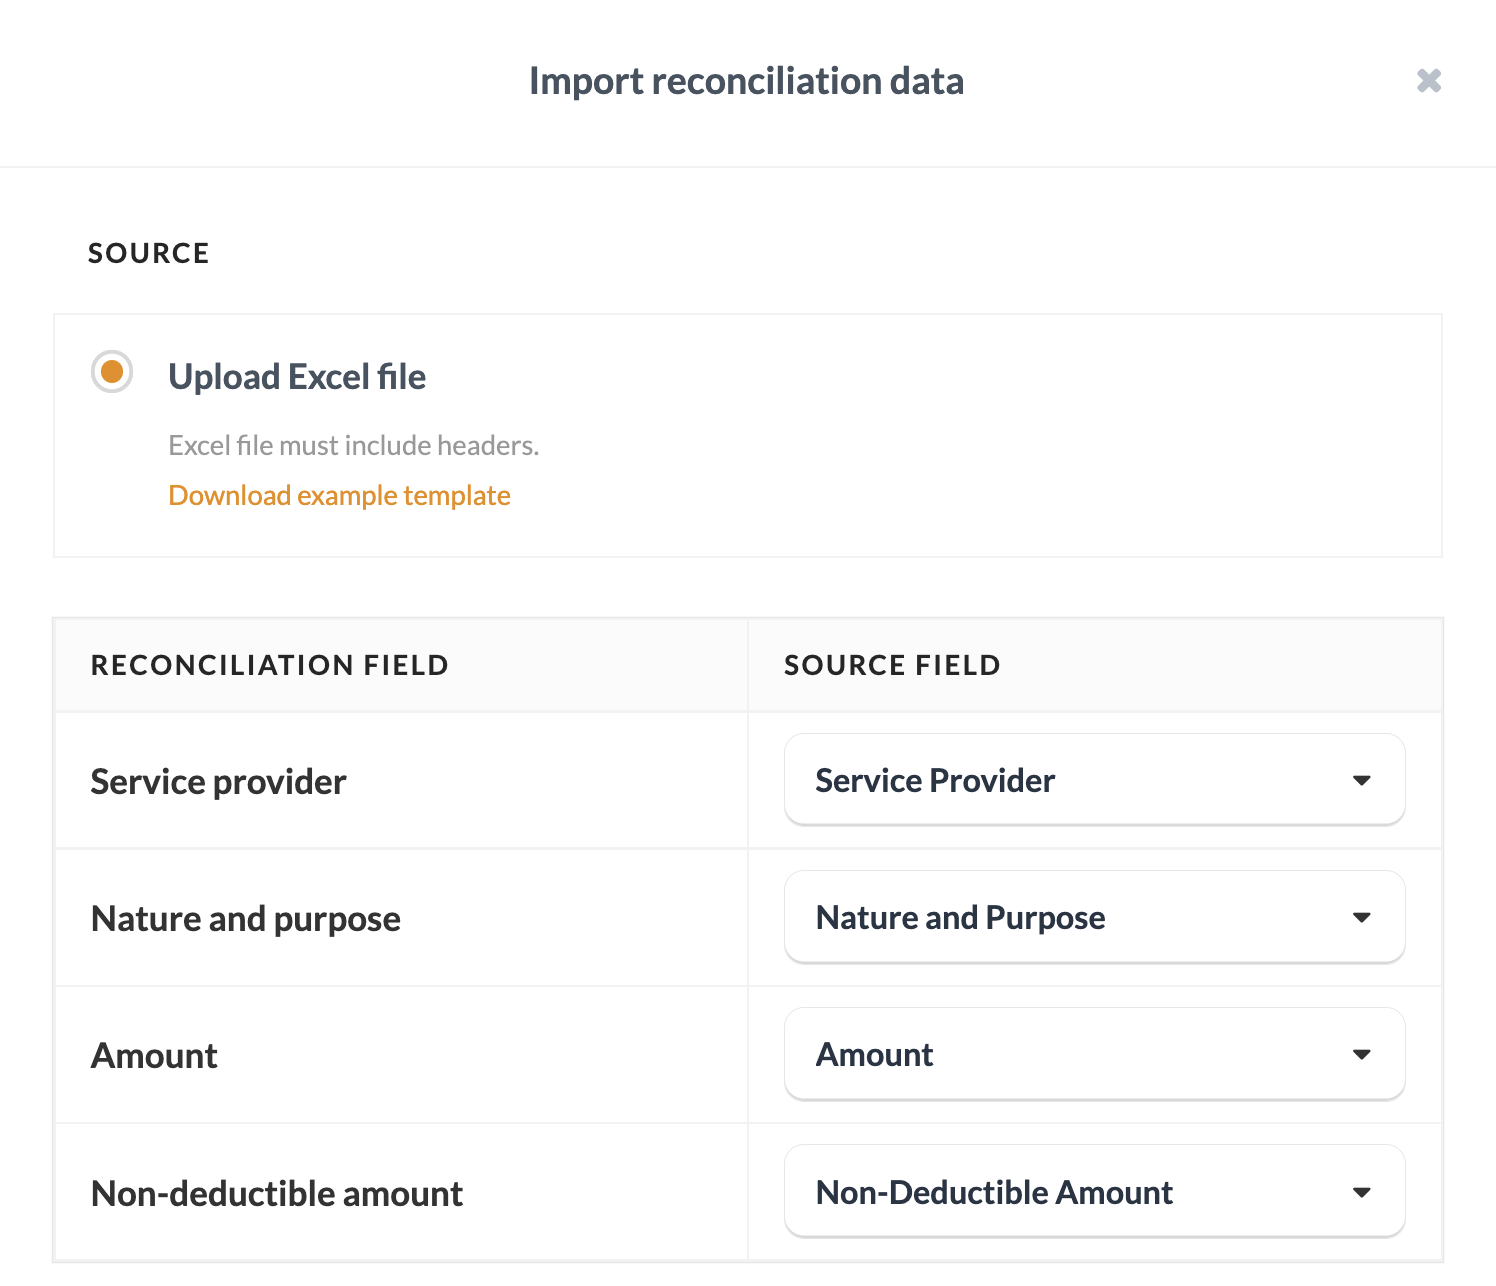
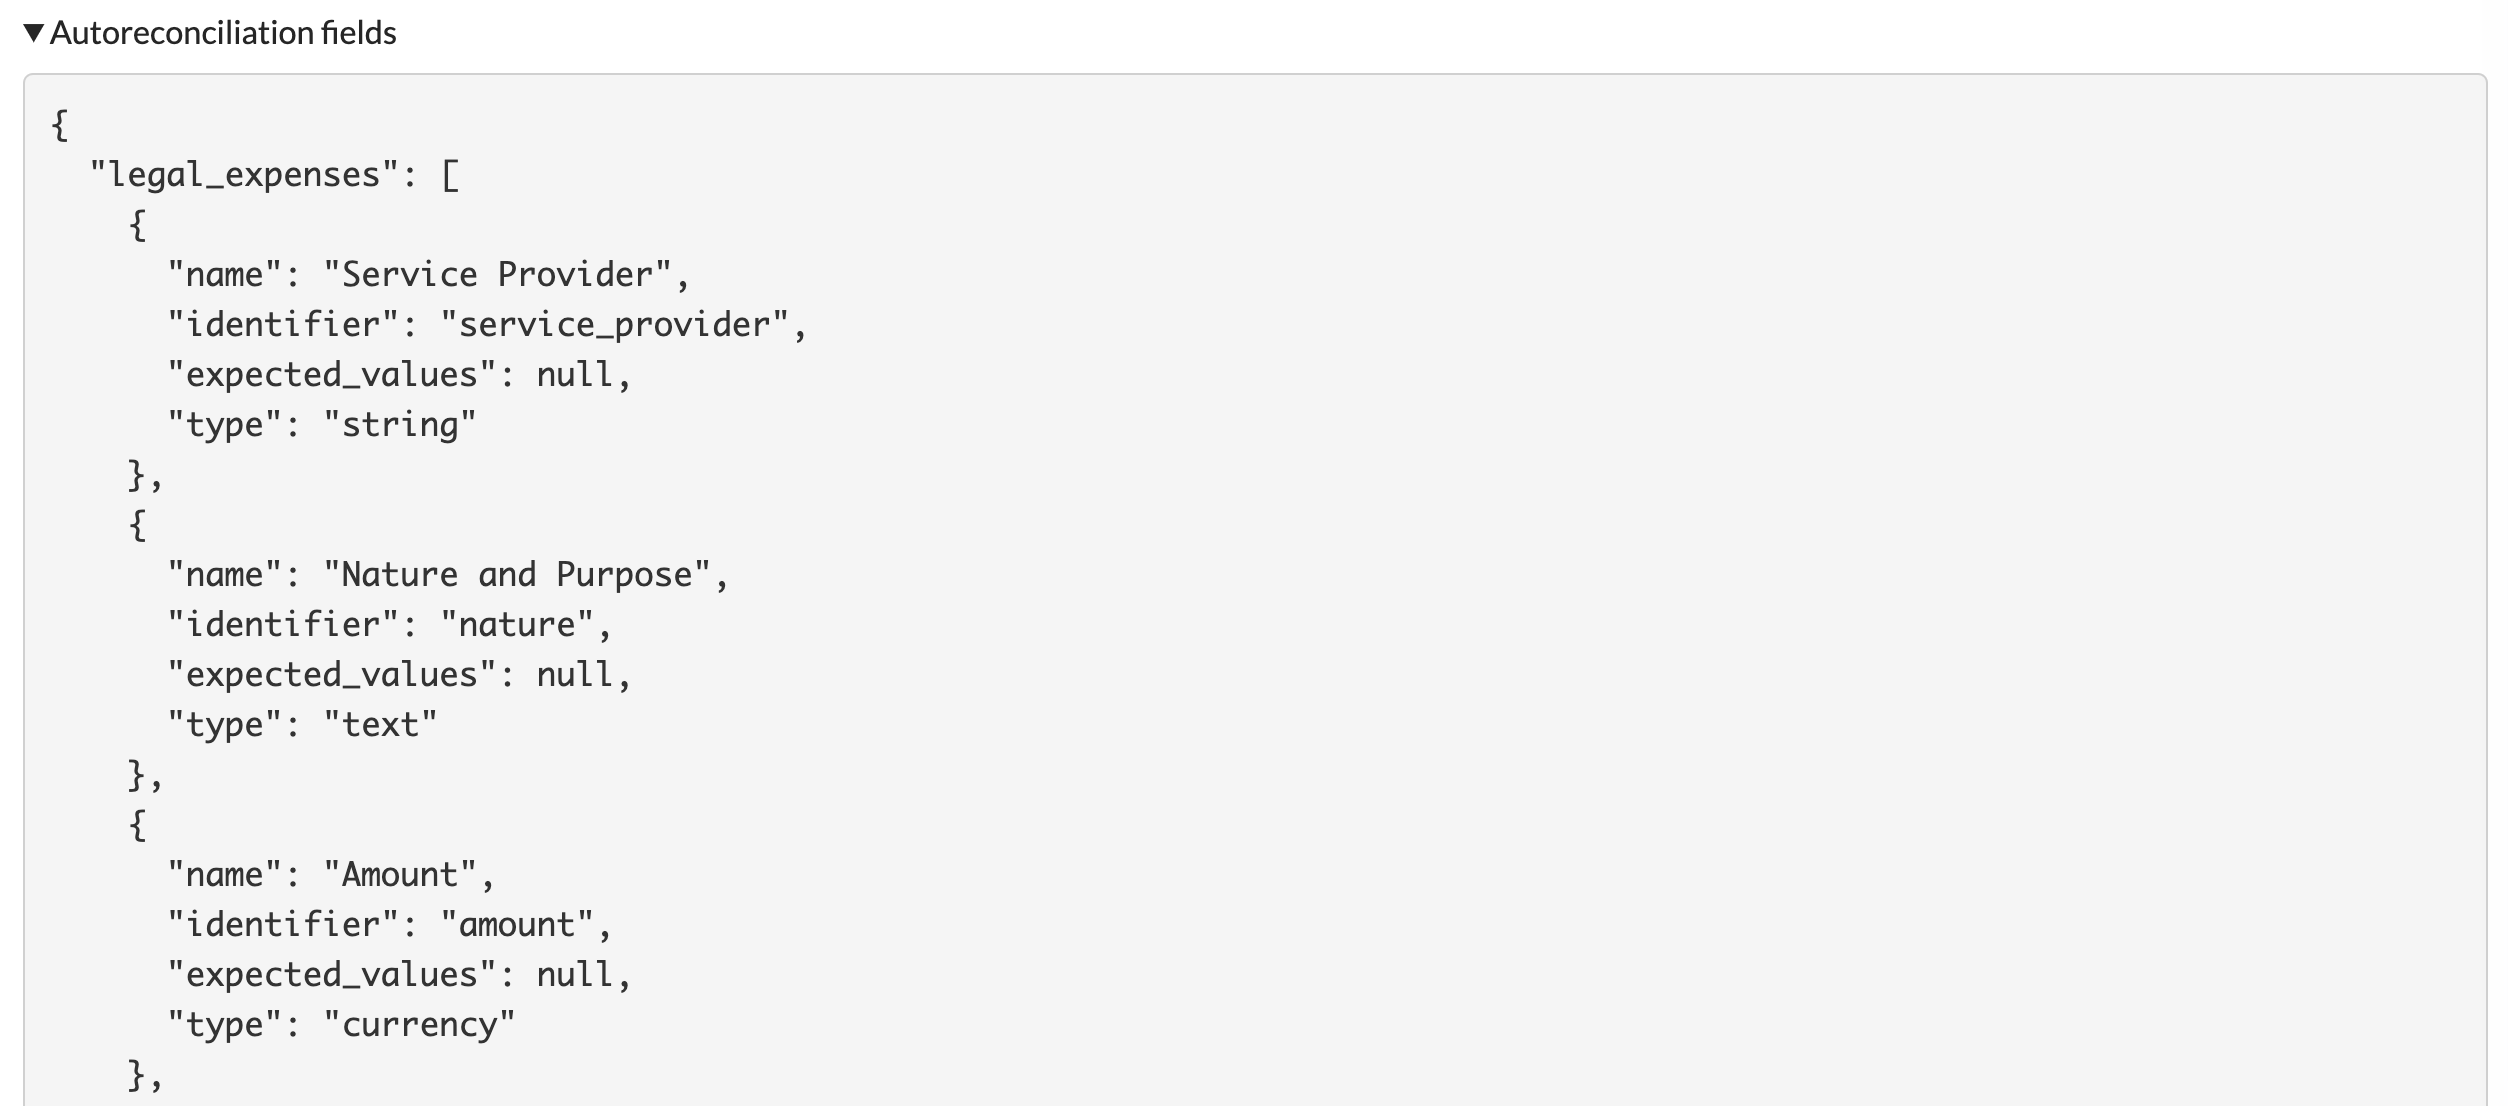
The ‘Autoreconciliation fields’ section gives an overview of all the inputs that can be completed through the Import reconciliation data function. In Silverfin, it is possible to upload your data into a certain template instead of having to complete it manually. However, the data that is being uploaded should exactly match the naming of the variables and its type. This information can be found here.
Here’s an example:
TextProperties
The TextProperties section contains some technical information about the content of input fields (more specifically custom drops). Only those fields that have actual content will be displayed in this list.

In the above example, a value was input in the field 8053P. In the TextProperties, this input will indeed be captured and present. The data shows us our particular input field is called custom.vol_6_2_4.vol_8053P in the code, and that it contains the value 10. vol_6_2_4 can be considered as the collection or namespace, vol_8053P is the variable name or key, and 10 is the content or payload.

TextProperties can be very helpful to immediately see which custom drops are being used in a certain template, and what content they have.
Translations

Translations will provide you an overview of all the translation tags being used in the code, with the actual translations in the different languages.
Rollforward parameters

This section shows a list of all the input fields that have specific rollforward logic defined. Each input field will have the following information:
- name (name of the collection + variable, following the structure 'collection.variable')
- value (future value that the input field will get if we execute a 'Copy data')
- file (boolean to see if the input field is a file)
This is a great place to check when copying details is not working in the way you expect it to.
Dependencies
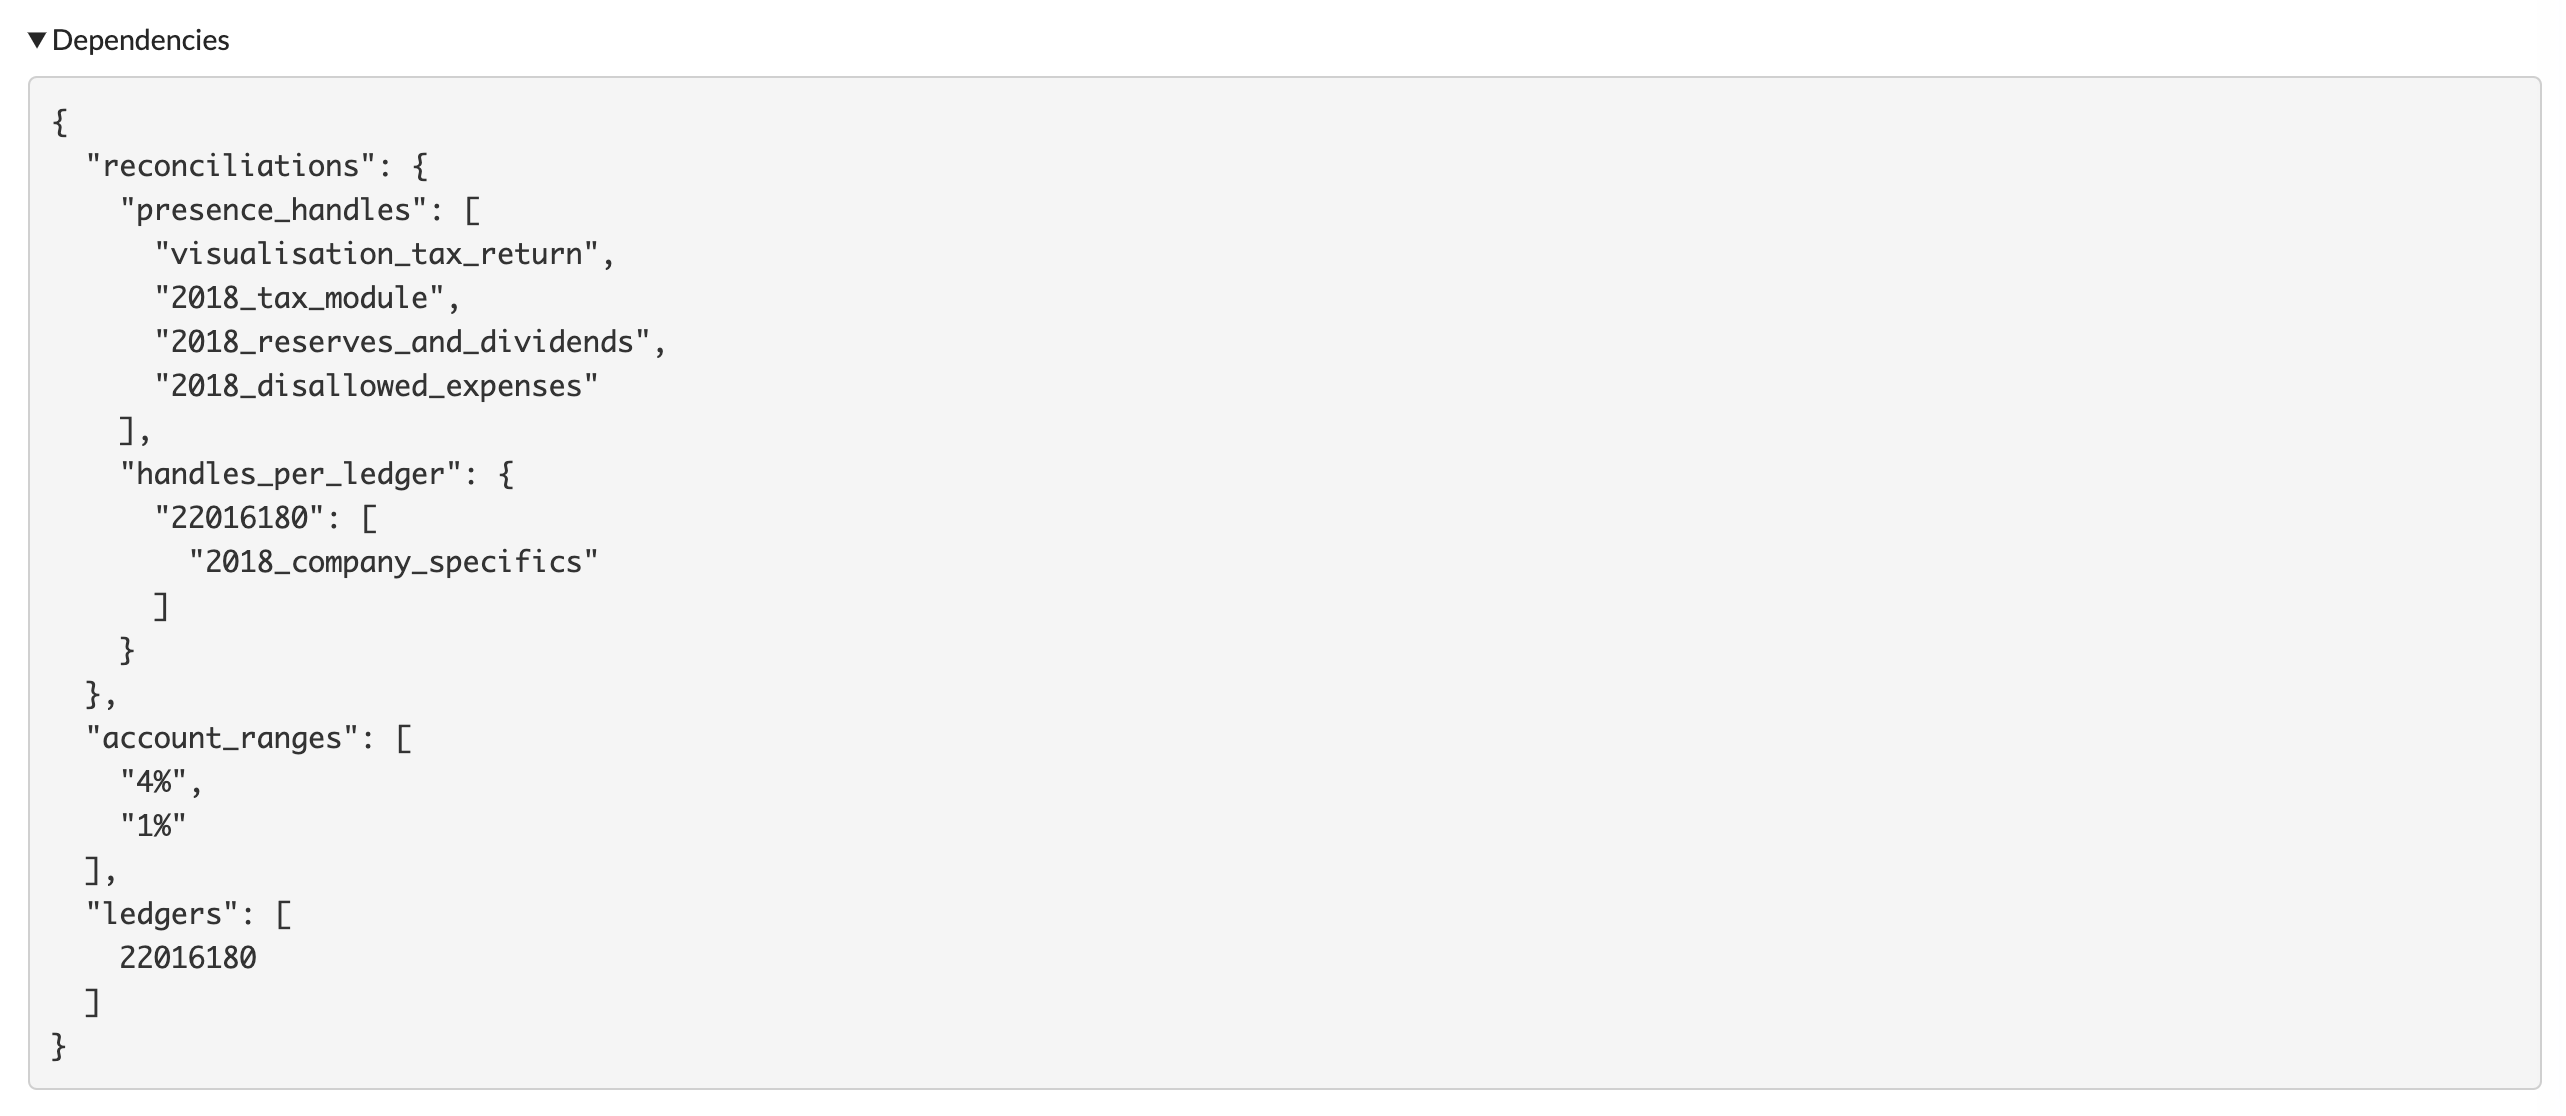
Dependencies provides information about what impacts the details of the template. This can be account ranges from account collections, certain results that are used from other templates, the ledgers of an account (the booking lines, or the total of it),… It gives an idea of which links the template has to external sources (not in the template itself).
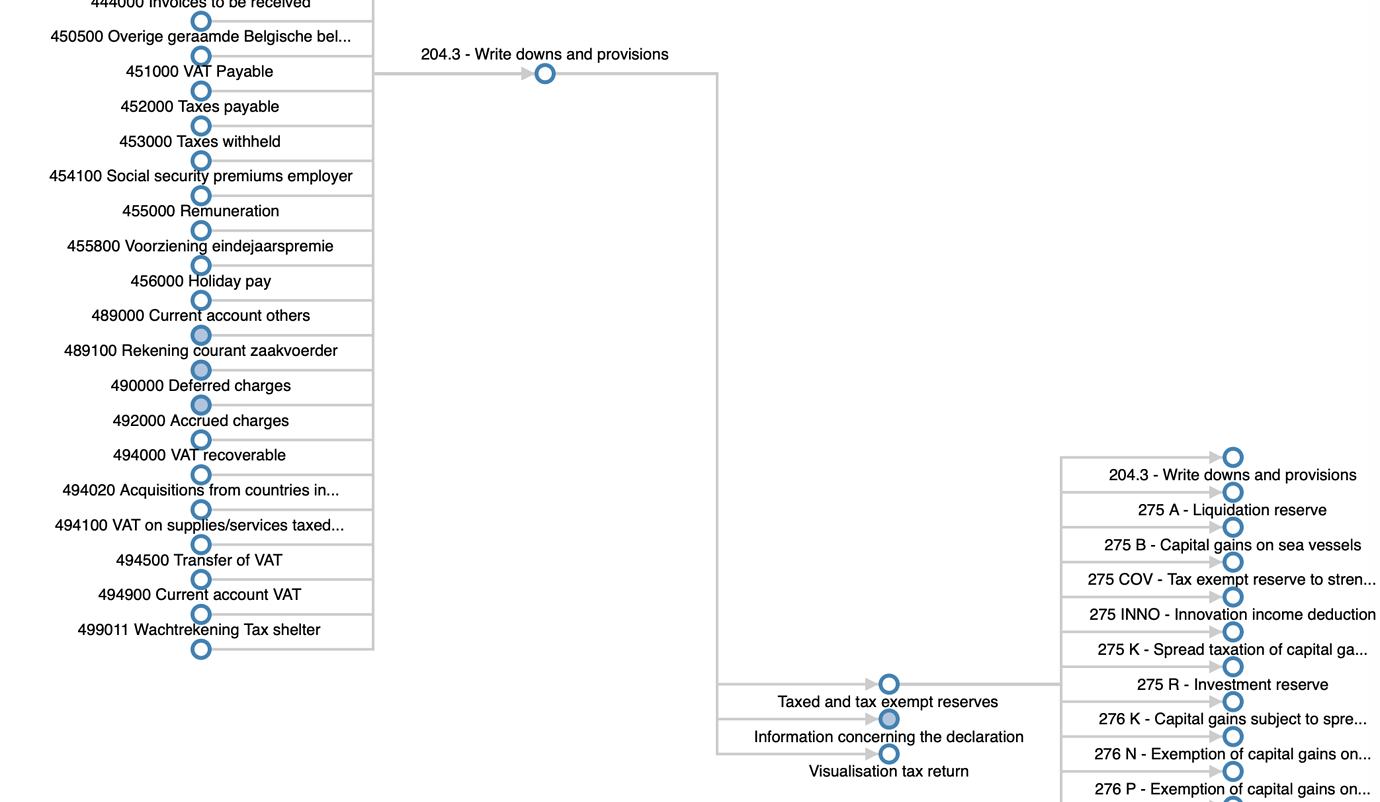
Dependencies tree
The final section of the debug panel is a visual representation of the dependencies of the template. It’s a double-sided tree graph, representing both the forward and backward dependencies of the template you are debugging.
The template you are debugging, is the root of it all, sitting in the middle of the tree.
left -------|
            |
            |
           root
            |
            |
            |------- right
On the left, you’ll see the templates in which our current template depends on (using their results for example).
On the right side, you’ll see the templates that depend on the current template.
The tree can thus be seen as a flow of results from left to right.
Here’s an example:
A couple of notes to be added:
- Due to the high number of dependencies in production templates, we reduced the tree depth to only 3 levels (including the root), with the 2nd-level nodes collapsed by default and we're only taking into account the dependencies from the current period (the template could also be referenced by future or previous periods, e.g.
period.minus_1y.reconciliations) - Since generating the tree can be resource-intensive for templates with lots of dependencies, it is only initiated after the debug section "Dependencies tree" is expanded for the first time. So you can still use the debug pane without any effect in performance - the tree will be generated on-demand, so only if you need it.
All these sections and tools have their own function and benefits. If you start using them, you will quickly see that they can make your life a lot easier when developing templates in Silverfin.
Updated 8 months ago
